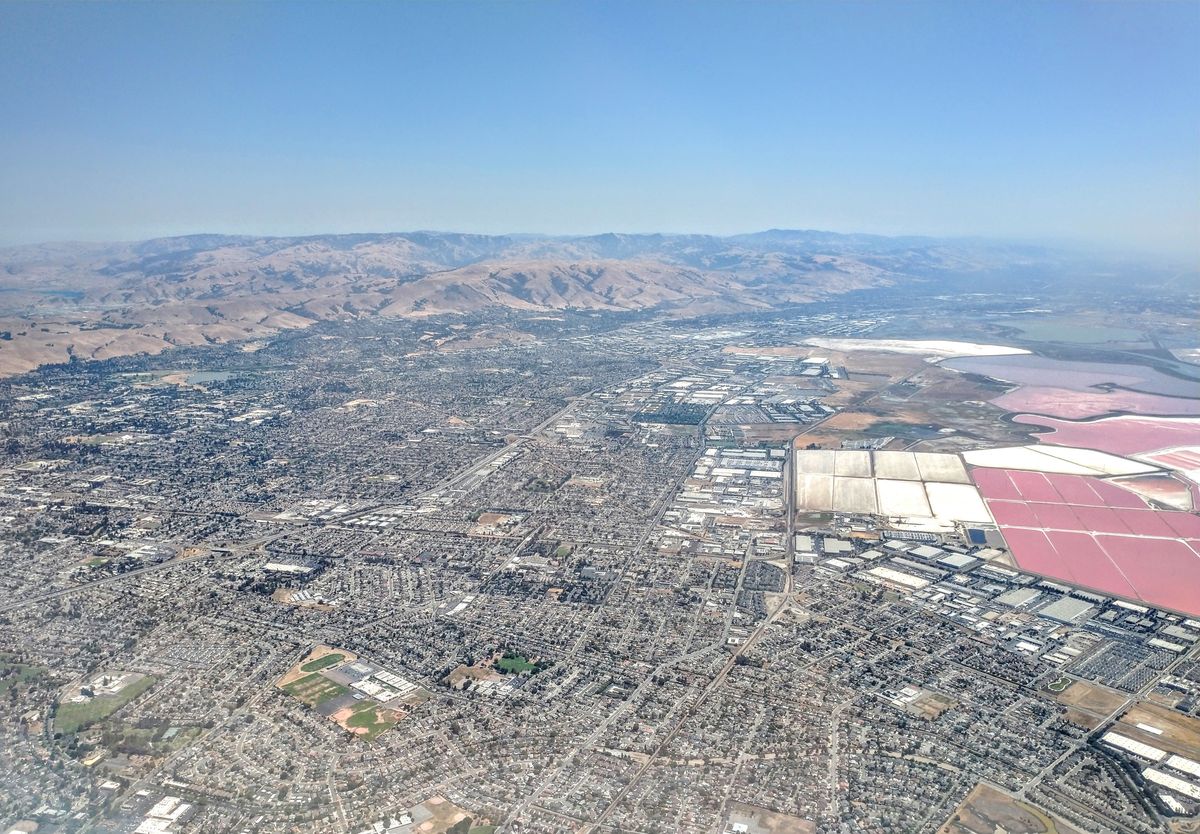
Fremont's median home sale price is $1,150,000 as of July 2026 (Movoto). Homes take a median of 45 days to sell — up from 35 a year ago — and a traditional 6% commission on that median costs $69,000. With Loqol's 2.5% seller-side commission, sellers can secure full-service representation while optimizing their net proceeds.
Fremont's median home sold for $1,150,000 in July 2026, with a 45-day median time on market — up from 35 days a year earlier — and 434 closings against 388 active listings, per Movoto Fremont. The 13-day, five-offers-per-listing market of early 2026 is gone; volume held almost exactly flat year over year (434 sold versus 432), but the clock roughly doubled and the median reset well below spring's prints. At that median, a traditional 5–6% commission costs a Fremont seller $57,500 to $69,000.
This is the full 2026 Fremont housing market report: the Mission San Jose / Warm Springs / Ardenwood / Niles / Centerville / Irvington submarket breakdown, the Tesla and South Fremont innovation-district demand story, the Dumbarton Peninsula spillover, and the commission math a Fremont seller actually faces at a $1,150,000 median — including how Loqol's 2.5% seller-side commission compares to traditional models.
To put the current market in context, Fremont's median home sold for $1,500,000 in March 2026, which was down 8.1% year-over-year, with a 13-day median days-on-market and an average of 5 offers per listing. By July 2026, the citywide median home sale price adjusted to $1,150,000 (or $1.15M), reflecting a shift in sales mix across submarkets.
Fremont at a Glance — 2026 Headline Numbers
| Metric | July 2026 | Year Ago | What It Means for Sellers |
|---|---|---|---|
| Median sold price | $1,150,000 | — | Reset from the $1.5M March print; mix-driven across six submarkets |
| Median days on market | 45 days | 35 days | The 13-day, five-offer market is over — day-one pricing decides |
| Homes sold | 434 | 432 | Volume is intact; the clock is what changed |
| Active listings / new | 388 / 65 | — | A real shelf of competing inventory |
| Price reduced | 54 of 388 active | — | ~14% cut rate — aspirational asks get ground down |
| Price per square foot | ~$751 | — | The per-foot number travels better across submarkets than the median |
The number that moved is the median, not the market. Fremont closed 434 homes in July 2026 against 432 a year earlier — volume is intact — while the median sale price reset to $1,150,000 and time on market stretched to 45 days from 35. A slower, better-supplied market (388 active listings, 65 new, 54 already carrying a price cut) at roughly $751 per square foot. Sales mix matters here more than in most cities: Fremont's submarkets span nearly a million dollars, so a quarter with fewer Mission San Jose closings pulls the citywide median down without any individual home losing that value.
The Fremont Submarkets Sellers Actually Need to Know
Fremont is a city of distinct submarkets — six recognizable districts with material price differences. A "Fremont seller" with a Mission San Jose 4-bed is in a different market than a Niles cottage owner. Pricing your listing requires knowing which Fremont you live in.
| Submarket | Position vs. $1,150,000 Citywide Median | What Drives It |
|---|---|---|
| Mission San Jose | Highest — a large premium over citywide | Top-rated FUSD schools (Mission San Jose HS), older premium SFH stock |
| Warm Springs | Premium | Tesla Fremont proximity, newer SFH stock, Warm Springs BART |
| Ardenwood | Modest premium | Well-rated Ardenwood Elementary, Dumbarton commute, Peninsula spillover demand |
| Centerville / Irvington | Near citywide | Mid-century SFH, transit-accessible, deep and liquid submarkets |
| Niles | Below citywide | Historic downtown core, older SFH stock, smaller lots |
Submarket positions are directional. Fremont does not publish a monthly median for every district, and the citywide median reset to $1,150,000 in July 2026 — price your listing against your own district's closings from the last 90 days, not against the citywide number.
Two things hold across the cycle. Mission San Jose commands a substantial premium over Warm Springs for comparable square footage — that is the school-zone math at work, particularly for K-12 families weighing Cupertino and Palo Alto alternatives. And Ardenwood behaves like a Peninsula satellite rather than a Fremont neighborhood, because Dumbarton-commuting buyers underwrite it against Menlo Park and Palo Alto, not against Niles.
What Sellers at the Fremont Median Actually Keep — Commission Math
At the citywide $1,150,000 July 2026 median, a traditional 5–6% commission is $57,500 to $69,000 — money out of your proceeds before you see a dollar. Here is what that math looks like across Fremont's price tiers, comparing traditional rates to Loqol's 2.5% seller-side commission.
| Home sale price | Listing side at Loqol's 2.5% | Total at a traditional 5% | Total at a traditional 6% |
|---|---|---|---|
| $900,000 | $22,500 | $45,000 | $54,000 |
| $1,150,000 | $28,750 | $57,500 | $69,000 |
| $1,600,000 | $40,000 | $80,000 | $96,000 |
| $2,200,000 | $55,000 | $110,000 | $132,000 |
| $3,200,000 | $80,000 | $160,000 | $192,000 |
Notes on the table. The listing-side commission is Loqol's 2.5% seller-side commission when onboarding through our platform. A dedicated licensed California real estate agent (Loqol, CA DRE #02261474) remains your direct point of contact and the agent of record on every listing. The comparison reflects the listing-side difference only — buyer-agent compensation is negotiated separately in the buyer's offer in the post-August-2024 NAR settlement era, and is not pre-set by the seller.
What's Actually Driving Fremont Demand — The Underwriting
Fremont's resilience in 2026 isn't accidental. Three durable factors anchor the demand side, even as the broader Bay Area has softened.
1. The Tesla / Warm Springs corridor. Tesla Fremont is the largest employer in the city and the largest auto manufacturing site west of the Mississippi. The Warm Springs / South Fremont innovation district that grew around it includes Lam Research, Western Digital, Seagate, and a deep secondary tier of EV and semiconductor companies. This is concentrated, high-income, BART-accessible employment — the demand profile that bid up Warm Springs from $1.4M to $2.05M in five years.
2. Mission San Jose's school-zone monopoly. Mission San Jose High School is consistently ranked among the top public high schools in California — and the elementary feeder system (Mission Valley, Hirsch, Chadbourne, Weibel) anchors the premium. School-zone families don't compromise on this; they'll pay the $650K Mission-vs-Warm-Springs premium for the K-12 path.
3. The Dumbarton Bridge / Peninsula spillover. Ardenwood's 12.9% YoY climb is the cleanest signal that Peninsula buyers priced out of Menlo Park ($2.6M median) and Palo Alto ($3.5M+) are buying Fremont west of I-880 and commuting across the Dumbarton. Ardenwood Elementary's strong ratings cinch the trade.
The reset in the citywide median reflects sales mix more than a market-wide repricing: more closings in the lower-priced Niles and Centerville stock, fewer at the Mission San Jose top end. What genuinely changed is pace and supply — 45 days versus 35 a year ago, with 54 of 388 active listings already discounted (~14%). Sellers who price to spring's asks are the ones adding to that price-cut count.
How Fremont Compares to Neighbors
| City | Median | Median DOM | Data Vintage / Source |
|---|---|---|---|
| Fremont | $1,150,000 | 45 days | July 2026 — Movoto (verified this update) |
| Union City | ~$1.25M | ~17 days | Prior LOQOL cornerstone print — see the Union City page for current data |
| Hayward | ~$900K | ~18 days | Prior LOQOL cornerstone print — see the Hayward page for current data |
| Milpitas | ~$1.4M | ~14 days | Prior LOQOL cornerstone print — see the Milpitas page for current data |
| Pleasanton | ~$1.65M | ~12 days | Prior LOQOL cornerstone print — see the Pleasanton page for current data |
Fremont sits in the middle of the Tri-City / Tri-Valley pricing band — above Hayward and Union City, near Milpitas, and below Pleasanton. What changed in 2026 is pace rather than rank: at 45 median days on market, up from 35 a year ago, Fremont no longer clears faster than its neighbors on the strength of demand alone. Neighbor figures in the table are prior LOQOL cornerstone prints and are shown for directional context only; each city's own page carries its current data.
What Fremont Sellers Should Do in 2026
If you're in Mission San Jose: price to the school-zone premium, not the citywide median. Comps within the Mission feeder system are the only relevant comps — and in a 45-day market, the day-one number does more work than any marketing does.
If you're in Warm Springs: lead the marketing with the Tesla / BART commute story. Buyers in this submarket are commuting to South Fremont or hopping BART south to Berryessa. Your photos should make the proximity visible — walkable to the station, garage that fits an EV, etc.
If you're in Ardenwood: you're in the up-cycling submarket. Schools matter, and the Dumbarton commute matters even more. Highlight both. Comps to Palo Alto / Menlo Park are how buyers underwrite Ardenwood — make sure your listing acknowledges that frame.
If you're in Niles or Centerville: the older-stock submarkets carry the most pricing pressure, and the citywide 45-day median understates it. Budget for a longer runway and price to the comps, not to aspiration.
Frequently Asked Questions
What is the median home price in Fremont, California in 2026?
The Fremont median sale price was $1,150,000 in July 2026, per Movoto Fremont, at roughly $751 per square foot. That is a meaningful reset from the $1.5M March 2026 print — driven substantially by sales mix, since Fremont's submarkets span close to a million dollars in median value.
How long do homes take to sell in Fremont?
The median time on market in Fremont was 45 days in July 2026, up from 35 days a year earlier (Movoto). Volume was essentially flat — 434 homes sold in July versus 432 a year ago — against 388 active listings and 65 newly listed. The early-2026 pattern of 13-day sales and five offers per listing no longer describes this market.
Which Fremont neighborhood is most expensive?
Mission San Jose remains Fremont's most expensive submarket, carrying a substantial premium over the citywide median. The premium is anchored by Mission San Jose High School — one of California's top-ranked public high schools — and its elementary feeder system. Price to the feeder-system comps, not the citywide number.
How much does it cost to sell a home in Fremont with a traditional realtor?
At Fremont's $1,150,000 July 2026 median, a 5–6% traditional commission costs $57,500–$69,000 before closing costs. With Loqol's 2.5% seller-side commission, the listing-side commission is significantly reduced, allowing sellers to retain more of their hard-earned equity while receiving full-service representation from a dedicated agent.
Does the seller still pay the buyer's agent commission in 2026?
In the post-August-2024 NAR settlement landscape, buyer-agent compensation is negotiated in the buyer's offer, not pre-set by the seller. Many California buyers continue to ask sellers to cover buyer-agent fees as part of their offer, but the seller has full latitude to accept, counter, or decline — this is now a deal-by-deal negotiation rather than an automatic 2.5–3% line item.
Is Fremont a good place to sell in 2026?
Fremont still clears — 434 closings in July 2026, essentially flat against last July — but it clears on price, not on urgency. With a 45-day median, 388 active listings, and 54 of them already reduced, well-priced homes in Mission San Jose, Warm Springs, and Ardenwood transact on schedule while aspirational asks sit. Managing your transaction costs is a key lever within your control: choosing a full-service brokerage with a 2.5% seller-side commission helps maximize your net proceeds at the $1,150,000 median.
Partner With Loqol to Sell Your Fremont Home
Loqol (Sunday Real Estate Brokerage Inc. dba Loqol), CA DRE #02261474, is a full-service California brokerage with dedicated licensed agents serving Fremont sellers. When you onboard through Loqol, we offer a 2.5% seller-side commission. This comprehensive service includes a dedicated licensed agent reachable directly at any point in the transaction, a seller dashboard with full visibility into the deal, all documents and disclosures in one place with complete deal and document history, signage installation, and marketing run by Loqol's in-house marketing team. Every Loqol agent is a licensed California agent we onboarded with prior transaction experience, and our roster has closed 100+ listings between them. Our agents work on software we built ourselves, so every disclosure, deadline, and document in your sale is tracked rather than remembered — and you can see all of it, and reach your agent, in one click. Charlie is Loqol's in-house AI. Our agents use it to run the transaction, and in your seller dashboard you can ask it what's happening with your sale at any point and get an answer grounded in your actual deal — with your agent one click away.
Read the Best Real Estate Agents in Fremont (2026) guide
Selling in Fremont?
Loqol is a full-service California brokerage working with sellers in Fremont. Every Loqol agent is a licensed California agent we onboarded with prior transaction experience, and our roster has closed 100+ listings between them.
Talk to a Loqol agent about your Fremont sale.
Want more clarity like this?
Clear, actionable guidance on selling and buying — straight to your inbox.